1 Jan
1 Feb
1 Mar
1 Apr
1 May
1 Jun
1 Jul
1 Aug
1 Sep
0
100.000.000
200.000.000
300.000.000
400.000.000
500.000.000
600.000.000
700.000.000
800.000.000
900.000.000
Global
România
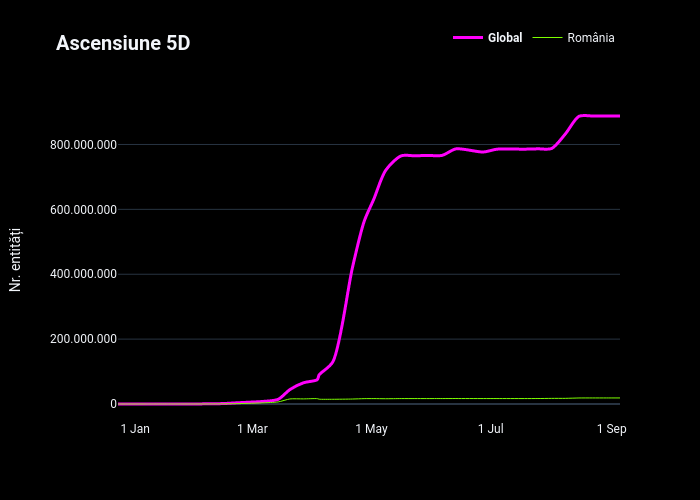
Ascensiune 5D
Nr. entități
plotly-logomark
Edit chart
Lukasig's interactive graph and data of "Ascensiune 5D" is a line chart, showing Global vs România; with in the x-axis and Nr. entități in the y-axis.. The x-axis shows values from 2019-12-24 to 2020-09-06. The y-axis shows values from -49316892.6111111 to 937087799.611111.