Edit chart
Loading graph
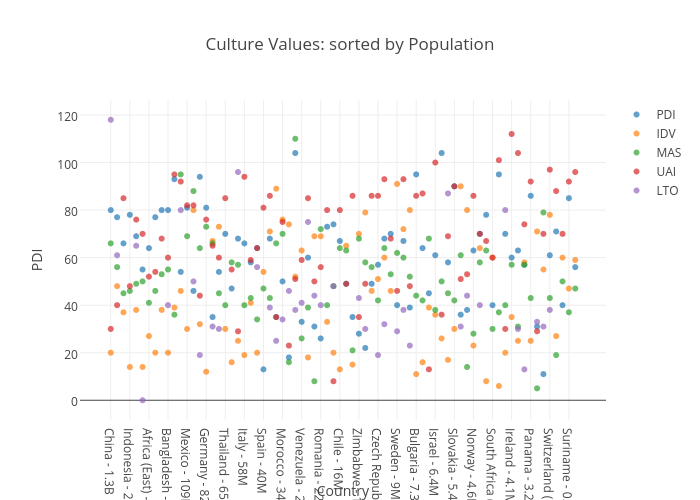
Lukelinz's interactive graph and data of "Culture Values: sorted by Population" is a scatter chart, showing PDI, IDV, MAS, UAI, LTO; with Country in the x-axis and PDI in the y-axis.. The x-axis shows values from -4.620081662954715 to 77.62008166295472. The y-axis shows values from -8.734929078014185 to 126.73492907801419.