Edit chart
Loading graph
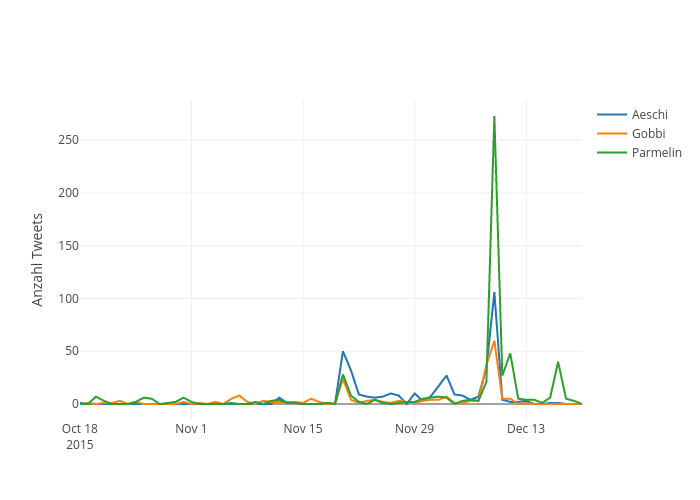
Lumoeh's interactive graph and data of "Anzahl Tweets vs time" is a scatter chart, showing Aeschi, Gobbi, Parmelin; with time in the x-axis and Anzahl Tweets in the y-axis.. The x-axis shows values from 1445119200000 to 1450566000000. The y-axis shows values from -15.166666666666671 to 288.1666666666667.