Edit chart
Loading graph
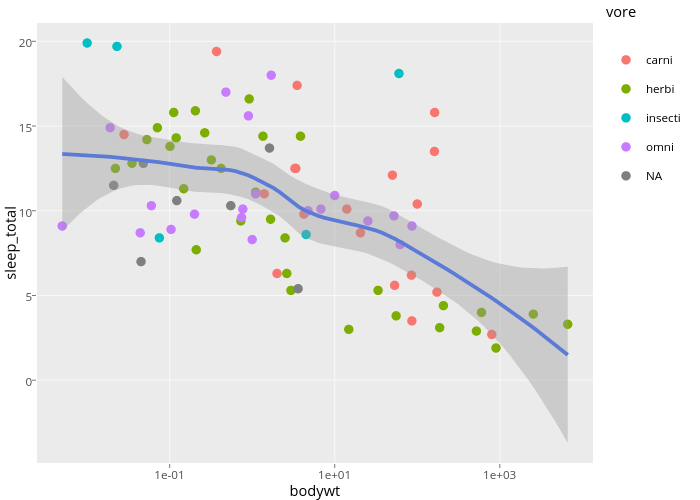
Lvaudor's interactive graph and data of "sleep_total vs bodywt" is a scatter chart, showing carni, herbi, insecti, omni, NA, fitted values, ; with bodywt in the x-axis and sleep_total in the y-axis.. The x-axis shows values from -2.60723563527382 to 4.12928843614264. The y-axis shows values from -4.88548499334193 to 21.0802611901591. This visualization has the following annotation: vore