Edit chart
Loading graph
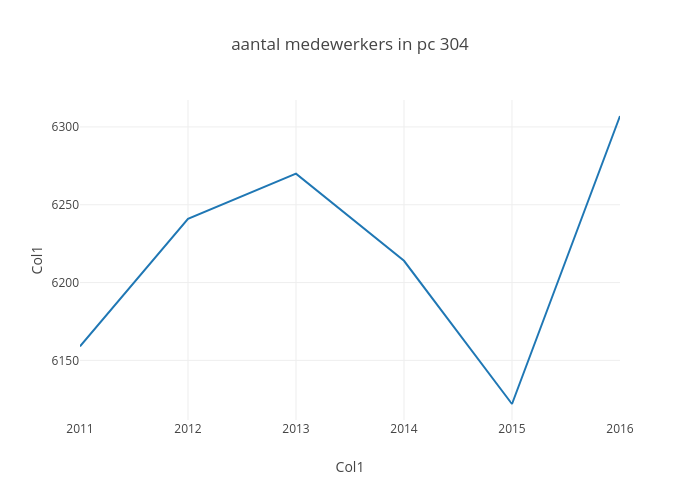
Maartenbres's interactive graph and data of "aantal medewerkers in pc 304" is a line chart, showing Col2; with Col1 in the x-axis and Col1 in the y-axis.. The x-axis shows values from 2011 to 2016. The y-axis shows values from 6111.722222222223 to 6317.277777777777.