Edit chart
Loading graph
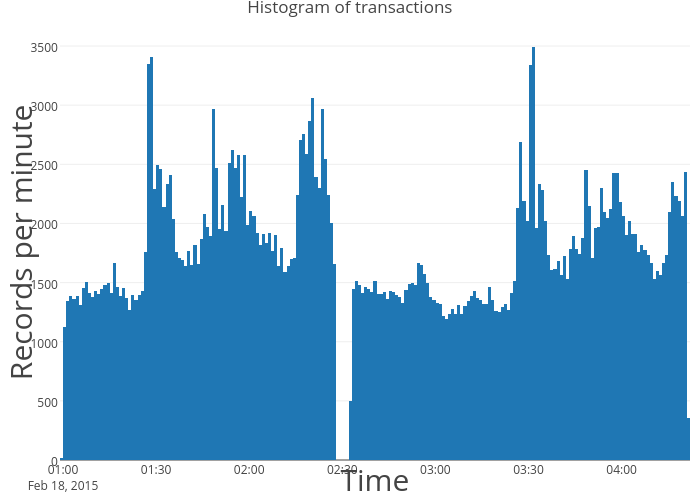
Madhuraraju's interactive graph and data of "Histogram of transactions" is a histogram; with Time in the x-axis and Records per minute in the y-axis.. The x-axis shows values from 2015-02-18 00:59 to 2015-02-18 04:22. The y-axis shows values from 0 to 3677.8947368421054.