Edit chart
Loading graph
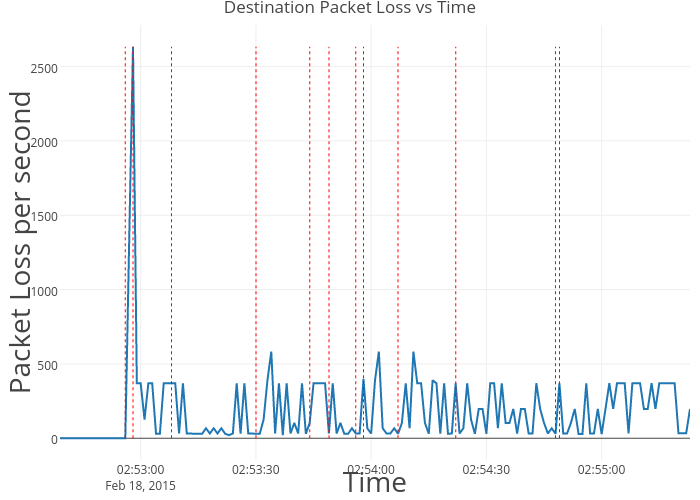
Madhuraraju's interactive graph and data of "Destination Packet Loss vs Time" is a line chart, showing Packet Loss over time; with Time in the x-axis and Packet Loss per second in the y-axis.. The x-axis shows values from 2015-02-18 02:52:39 to 2015-02-18 02:55:23. The y-axis shows values from -146.2777777777778 to 2779.277777777778.