Edit chart
Loading graph
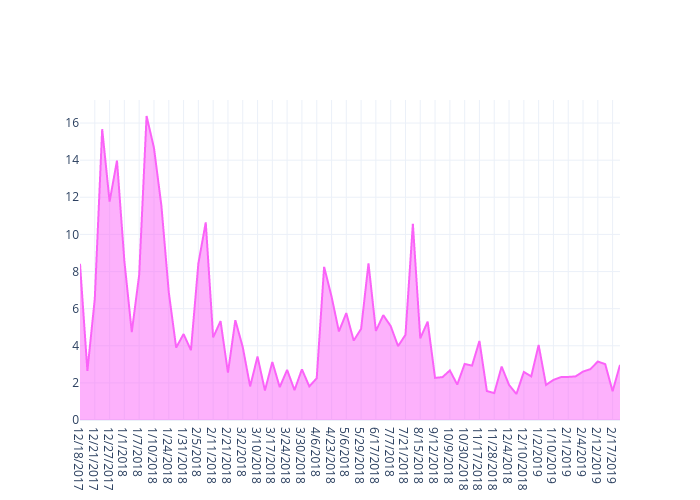
Madison_piercy's interactive graph and data is a line chart. The x-axis shows values from 0 to 73. The y-axis shows values from 0 to 17.242105263157892.