Edit chart
Loading graph
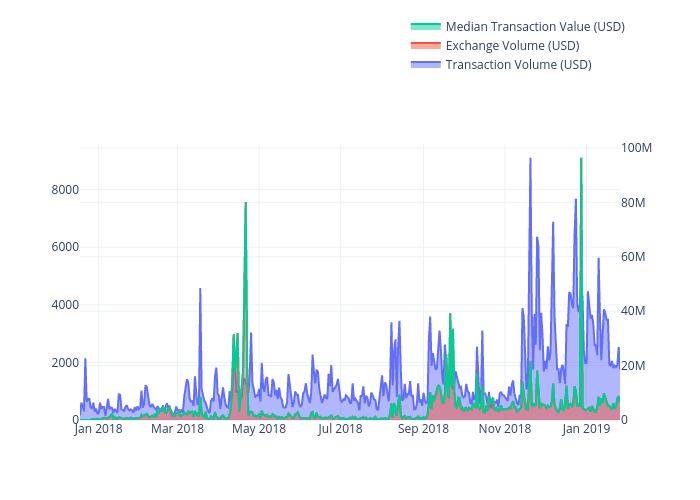
Madisonleeanne11's interactive graph and data of "Transaction Volume (USD), Exchange Volume (USD), Median Transaction Value (USD)" is a line chart, showing Transaction Volume (USD), Exchange Volume (USD), Median Transaction Value (USD); with time in the x-axis. The x-axis shows values from 2017-12-18 to 2019-01-26. The y-axis shows values from 0 to 9583.157894736842.