Edit chart
Loading graph
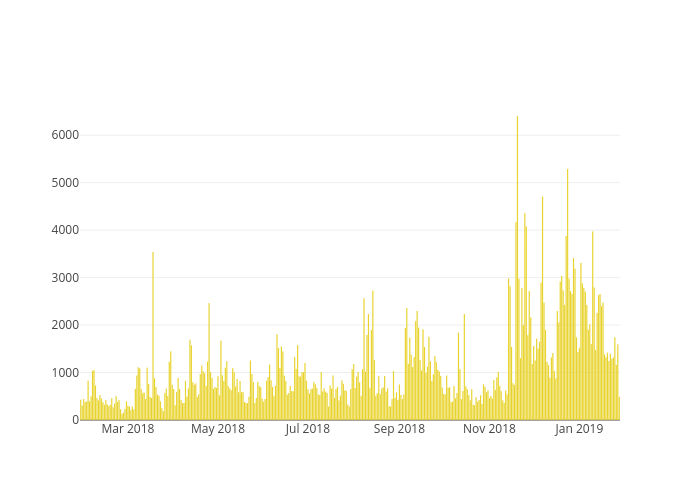
Madisonleeanne11's interactive graph and data is a bar chart; with time in the x-axis. The x-axis shows values from 2018-01-27 12:00 to 2019-01-28 12:00. The y-axis shows values from 0 to 6742.105263157895.