Edit chart
Loading graph
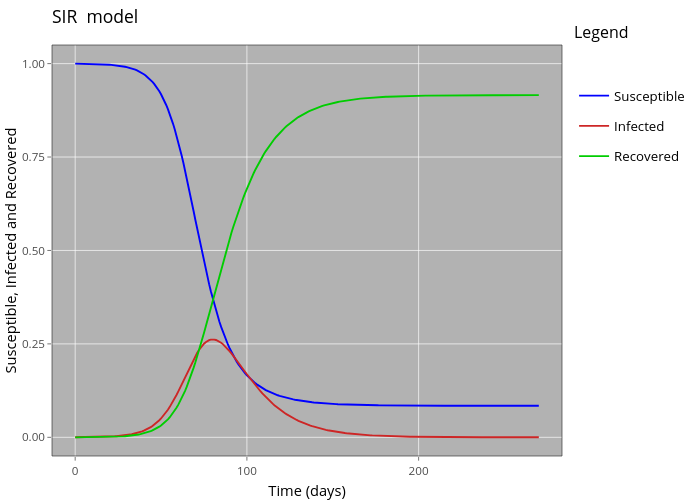
Marcasti's interactive graph and data of "SIR model" is a line chart, showing Susceptible, Infected, Recovered; with Time (days) in the x-axis and Susceptible, Infected and Recovered in the y-axis.. The x-axis shows values from -13.5 to 283.5. The y-axis shows values from -0.04999 to 1.04979. This visualization has the following annotation: Legend