Edit chart
Loading graph
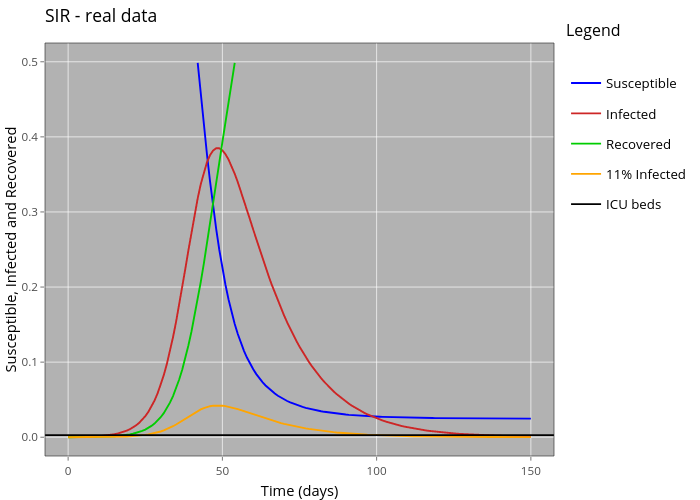
Marcasti's interactive graph and data of "SIR - real data " is a line chart, showing Susceptible, Infected, Recovered, 11% Infected, ICU beds; with Time (days) in the x-axis and Susceptible, Infected and Recovered in the y-axis.. The x-axis shows values from -7.5 to 157.5. The y-axis shows values from -0.025 to 0.525. This visualization has the following annotation: Legend