Edit chart
Loading graph
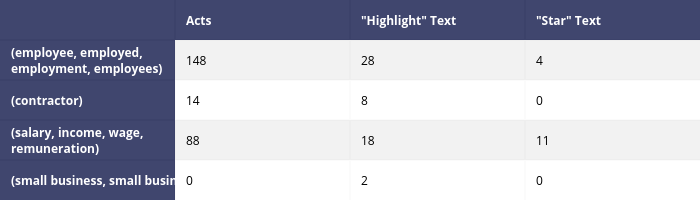
Markmuir87's interactive graph and data is a heatmap. The x-axis shows values from 0 to 0. The y-axis shows values from 0 to 0. This visualization has the following annotations: ; Acts; "Highlight" Text; "Star" Text; (employee, employed,employment, employees); 148; 28; 4; (contractor); 14; 8; 0; (salary, income, wage,remuneration); 88; 18; 11; (small business, small businesses); 0; 2; 0