Edit chart
Loading graph
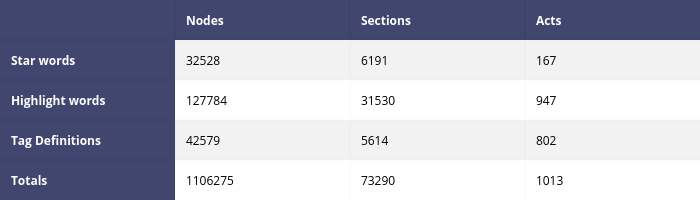
Markmuir87's interactive graph and data is a heatmap. The x-axis shows values from 0 to 0. The y-axis shows values from 0 to 0. This visualization has the following annotations: ; Nodes; Sections; Acts; Star words; 32528; 6191; 167; Highlight words; 127784; 31530; 947; Tag Definitions; 42579; 5614; 802; Totals; 1106275; 73290; 1013