Edit chart
Loading graph
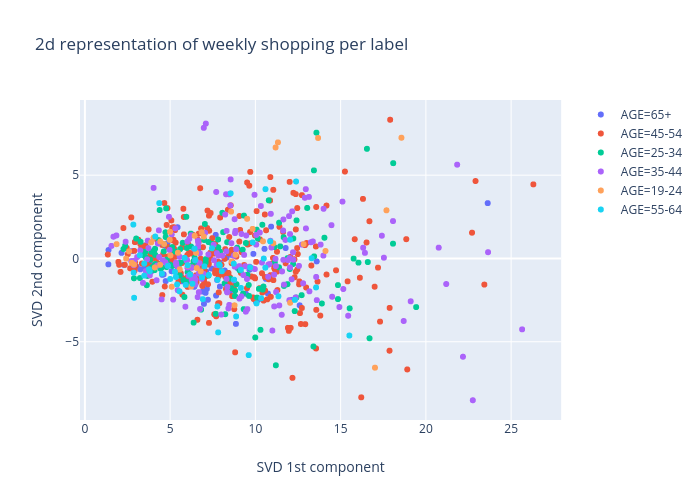
Marvande's interactive graph and data of "2d representation of weekly shopping per label" is a scatter chart, showing AGE=65+, AGE=45-54, AGE=25-34, AGE=35-44, AGE=19-24, AGE=55-64; with SVD 1st component in the x-axis and SVD 2nd component in the y-axis.. The x-axis shows values from 0 to 0. The y-axis shows values from 0 to 0.