Edit chart
Loading graph
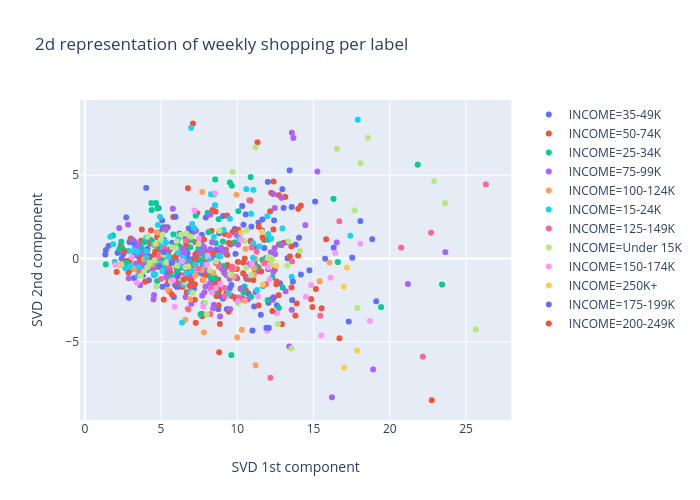
Marvande's interactive graph and data of "2d representation of weekly shopping per label" is a scatter chart, showing INCOME=35-49K, INCOME=50-74K, INCOME=25-34K, INCOME=75-99K, INCOME=100-124K, INCOME=15-24K, INCOME=125-149K, INCOME=Under 15K, INCOME=150-174K, INCOME=250K+, INCOME=175-199K, INCOME=200-249K; with SVD 1st component in the x-axis and SVD 2nd component in the y-axis.. The x-axis shows values from 0 to 0. The y-axis shows values from 0 to 0.