Edit chart
Loading graph
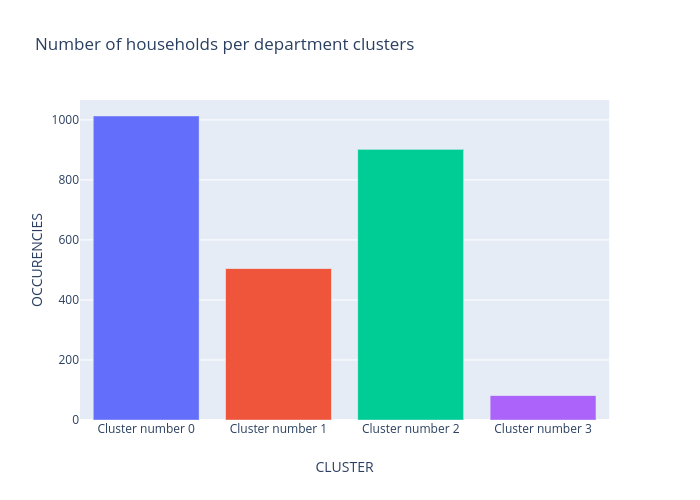
Marvande's interactive graph and data of "Number of households per department clusters" is a , showing CLUSTER=Cluster number 0, CLUSTER=Cluster number 1, CLUSTER=Cluster number 2, CLUSTER=Cluster number 3; with CLUSTER in the x-axis and OCCURENCIES in the y-axis.. The x-axis shows values from 0 to 0. The y-axis shows values from 0 to 0.