Edit chart
Loading graph
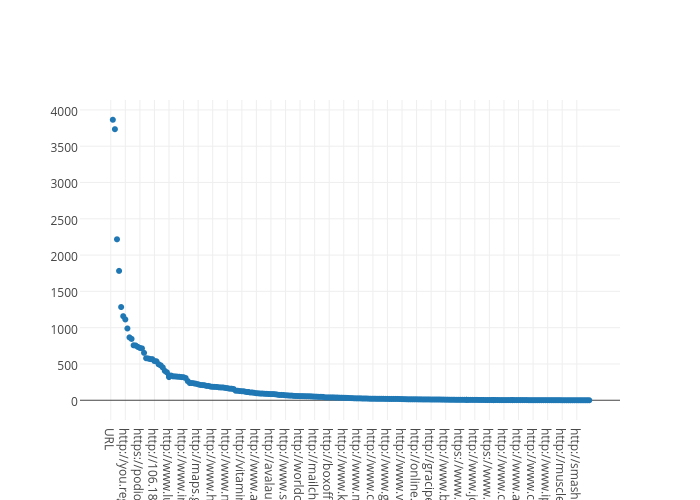
Masterdelrond's interactive graph and data of "Col3" is a scatter chart, showing Col3. The x-axis shows values from -13.511289705319557 to 243.51128970531957. The y-axis shows values from -244.15384615384613 to 4108.153846153846.