Edit chart
Loading graph
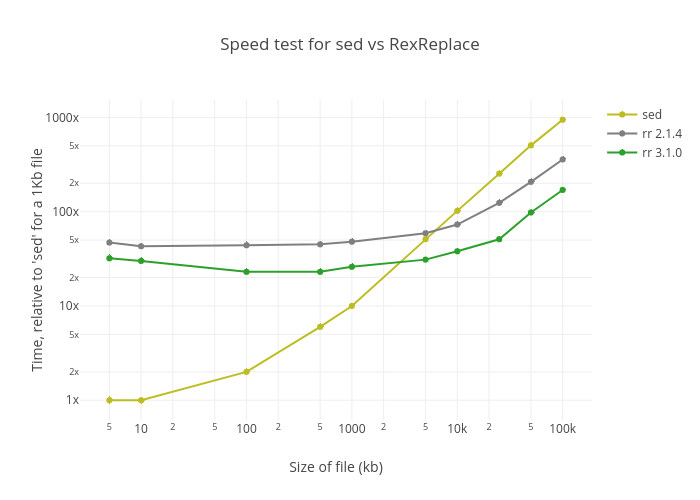
Mathiasrw's interactive graph and data of "Speed test for sed vs RexReplace" is a line chart, showing sed, rr 2.1.4, rr 3.1.0; with Size of file (kb) in the x-axis and Time, relative to 'sed' for a 1Kb file in the y-axis.. The x-axis shows values from 0.4289919310151195 to 5.2699780733209. The y-axis shows values from -0.21382975360505116 to 3.1888017479031197.