Edit chart
Loading graph
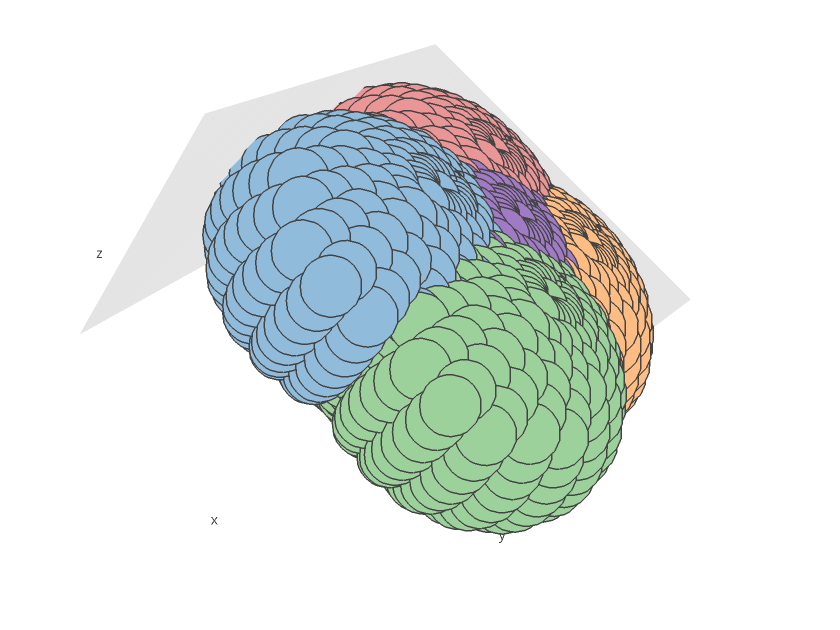
Matlab_user_guide's interactive graph and data of ", , , , " is a scatter3d, showing , , , , . The x-axis shows values from -1.5 to 1.5. The y-axis shows values from -1.5 to 1.5. This visualization has the following annotation: