Edit chart
Loading graph
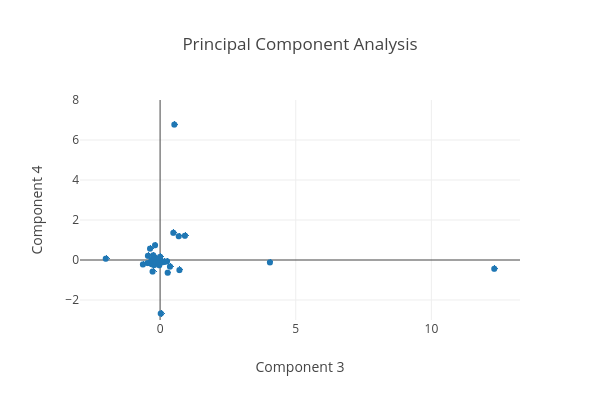
Matterhorn_ada's interactive graph and data of "Principal Component Analysis" is a scatter chart, showing Components 3 & 4; with Component 3 in the x-axis and Component 4 in the y-axis.. The x-axis shows values from 0 to 0. The y-axis shows values from -3 to 8.