Edit chart
Loading graph
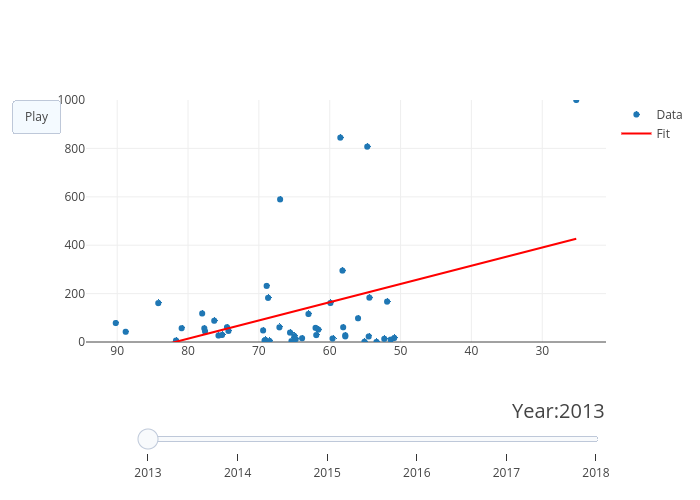
Mattius459's interactive graph and data of "UP(O)EP Value vs Descending Economic Freedom Score (The Heritage Foundation)" is a scatter chart, showing Data vs Fit; with Descending Economic Freedom Score (The Heritage Foundation) in the x-axis and UP(O)EP Value in the y-axis.. The x-axis shows values from 20 to 100. The y-axis shows values from 0 to 1000.