Edit chart
Loading graph
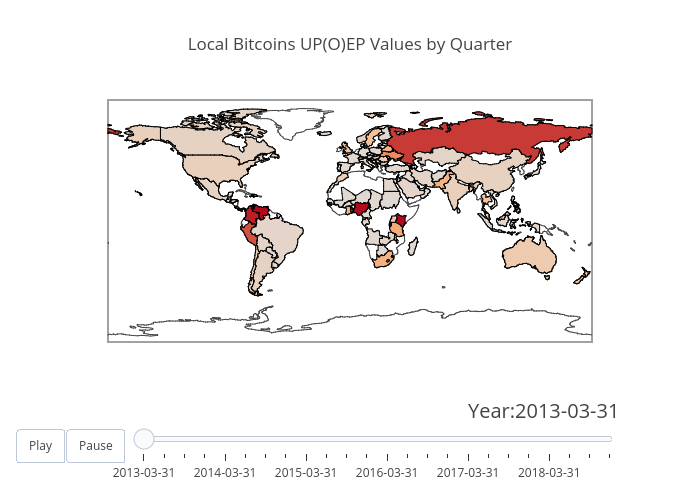
Mattius459's interactive graph and data of "Local Bitcoins UP(O)EP Values by Quarter" is a choropleth; with L in the x-axis and G in the y-axis.. The x-axis shows values from 30 to 85. The y-axis shows values from 0 to 0.