Edit chart
Loading graph
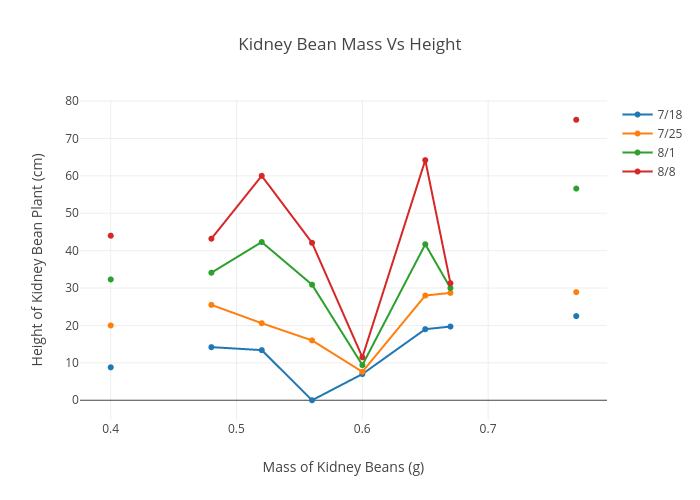
Maureen7609's interactive graph and data of "Kidney Bean Mass Vs Height " is a scatter chart, showing 7/18, 7/25, 8/1, 8/8; with Mass of Kidney Beans (g) in the x-axis and Height of Kidney Bean Plant (cm) in the y-axis.. The x-axis shows values from 0.37816004332250275 to 0.7918399566774973. The y-axis shows values from -4.836118251928021 to 79.83611825192801.