Edit chart
Loading graph
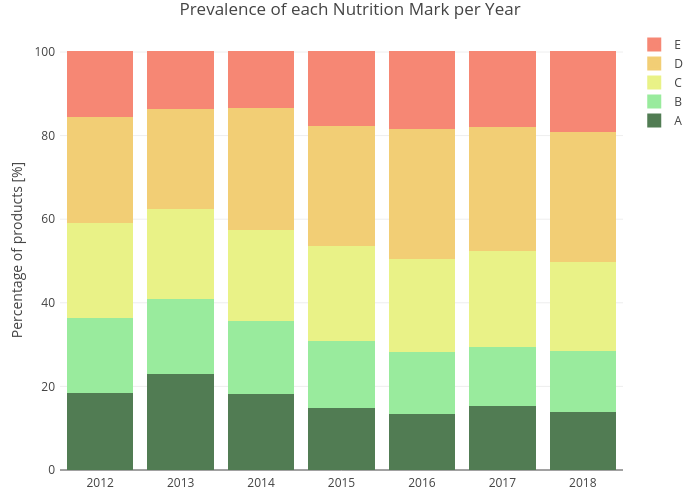
Maxencedraguet's interactive graph and data of "Prevalence of each Nutrition Mark per Year" is a stacked bar chart, showing A, B, C, D, E; with Percentage of products [%] in the y-axis. The x-axis shows values from 2011.5 to 2018.5. The y-axis shows values from 0 to 105.26315789473686.