Edit chart
Loading graph
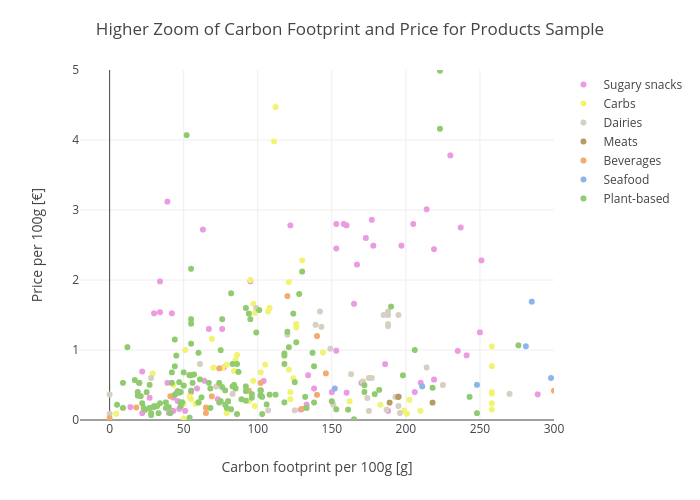
Maxencedraguet's interactive graph and data of "Higher Zoom of Carbon Footprint and Price for Products Sample" is a scatter chart, showing Sugary snacks, Carbs, Dairies, Meats, Beverages, Seafood, Plant-based; with Carbon footprint per 100g [g] in the x-axis and Price per 100g [€] in the y-axis.. The x-axis shows values from -20 to 300. The y-axis shows values from 0 to 5.