Edit chart
Loading graph
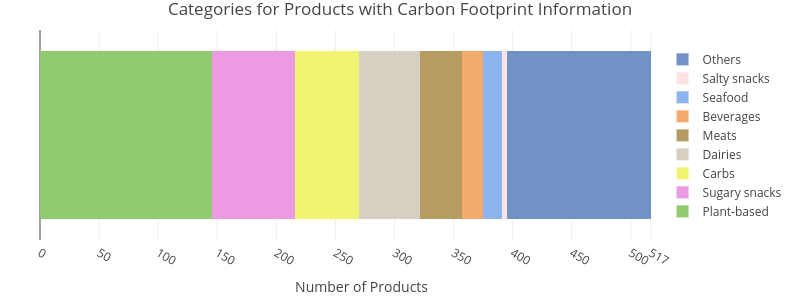
Maxencedraguet's interactive graph and data of "Categories for Products with Carbon Footprint Information" is a stacked bar chart, showing Plant-based, Sugary snacks, Carbs, Dairies, Meats, Beverages, Seafood, Salty snacks, Others; with Number of Products in the x-axis. The x-axis shows values from 0 to 544.2105263157895. The y-axis shows values from -0.5 to 0.5.