Edit chart
Loading graph
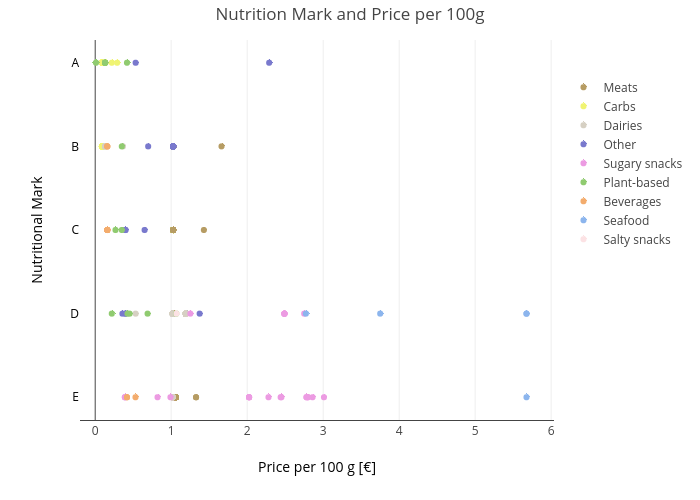
Maxencedraguet's interactive graph and data of "Nutrition Mark and Price per 100g" is a scatter chart, showing Meats, Carbs, Dairies, Other, Sugary snacks, Plant-based, Beverages, Seafood, Salty snacks; with Price per 100 g [€] in the x-axis and Nutritional Mark in the y-axis.. The x-axis shows values from -0.2 to 6.0370916114790285. The y-axis shows values from -0.2875048962005484 to 4.287504896200549.