Edit chart
Loading graph
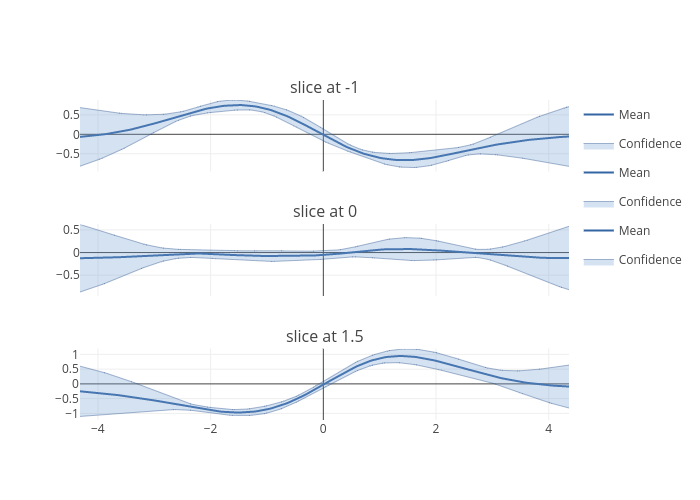
Maxz's interactive graph and data of "Mean, Confidence, Confidence, Mean, Confidence, Confidence, Mean, Confidence, Confidence" is a line chart, showing Mean, Confidence, Confidence, Mean, Confidence, Confidence, Mean, Confidence, Confidence. The x-axis shows values from 0 to 0. The y-axis shows values from 0 to 0. This visualization has the following annotations: slice at -1; slice at 0; slice at 1.5