Edit chart
Loading graph
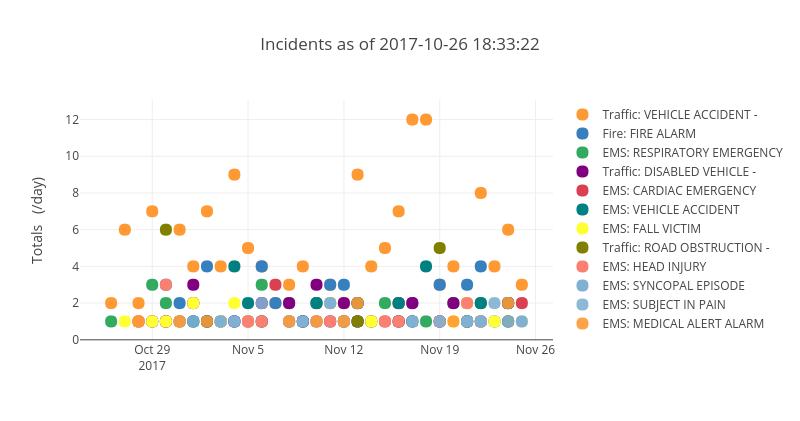
Mchirico's interactive graph and data of "Incidents as of 2017-10-26 18:33:22" is a scatter chart, showing Traffic: VEHICLE ACCIDENT -, Fire: FIRE ALARM, EMS: RESPIRATORY EMERGENCY, Traffic: DISABLED VEHICLE -, EMS: CARDIAC EMERGENCY, EMS: VEHICLE ACCIDENT, EMS: FALL VICTIM, Traffic: ROAD OBSTRUCTION -, EMS: HEAD INJURY, EMS: SYNCOPAL EPISODE, EMS: SUBJECT IN PAIN, EMS: MEDICAL ALERT ALARM; with Totals (/day) in the y-axis. The x-axis shows values from 0 to 0. The y-axis shows values from 0 to 0.