Edit chart
Loading graph
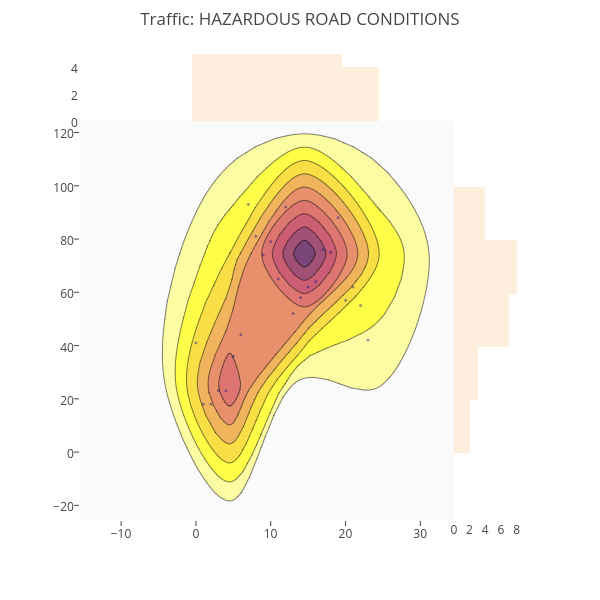
Mchirico's interactive graph and data of "Traffic: HAZARDOUS ROAD CONDITIONS" is a scatter chart, showing points, density, x density, y density. The x-axis shows values from -15.5 to 34.5. The y-axis shows values from -25.5 to 124.5.