Edit chart
Loading graph
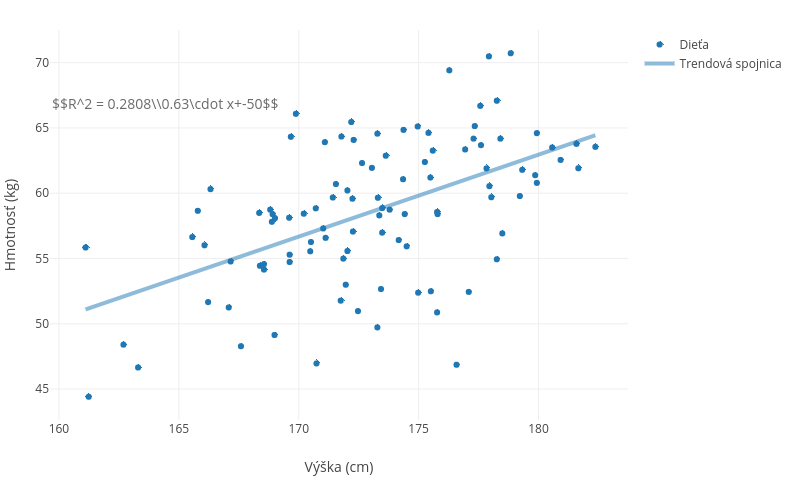
Mcibula's interactive graph and data of "Hmotnosť (kg) vs Výška (cm)" is a scatter chart, showing Dieťa vs Trendová spojnica; with Výška (cm) in the x-axis and Hmotnosť (kg) in the y-axis.. The x-axis shows values from 159.75580695584213 to 183.7241930441579. The y-axis shows values from 42.72009056839475 to 72.40990943160524. This visualization has the following annotation: $$R^2 = 0.2808\\0.63\cdot x+-50$$