Edit chart
Loading graph
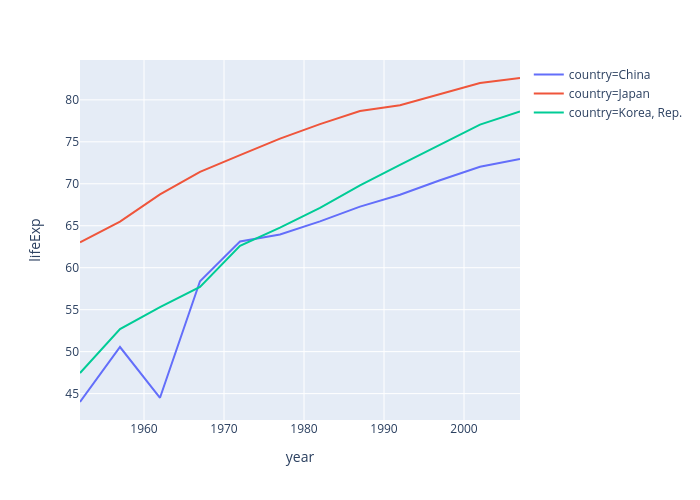
Mcwooil's interactive graph and data of "lifeExp vs year" is a line chart, showing country=China, country=Japan, country=Korea, Rep.; with year in the x-axis and lifeExp in the y-axis.. The x-axis shows values from 0 to 0. The y-axis shows values from 0 to 0.