Edit chart
Loading graph
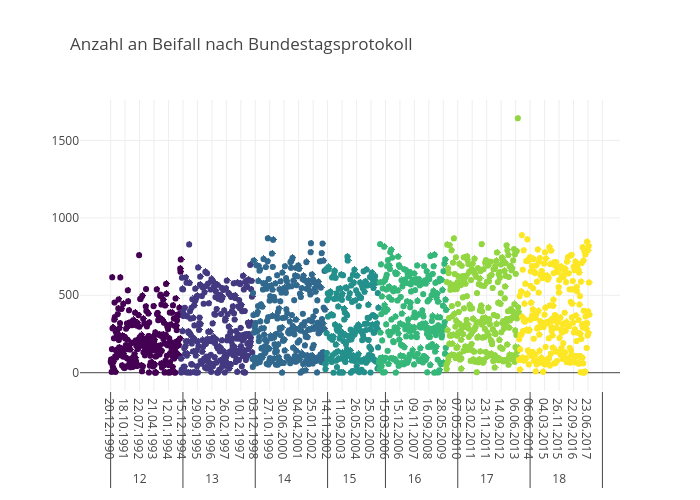
Mhaeussermann's interactive graph and data of "Anzahl an Beifall nach Bundestagsprotokoll" is a scatter chart, showing Zwischenrufe. The x-axis shows values from -103.65744535519127 to 1757.6574453551912. The y-axis shows values from -132.69237749546278 to 1775.6923774954628.