Edit chart
Loading graph
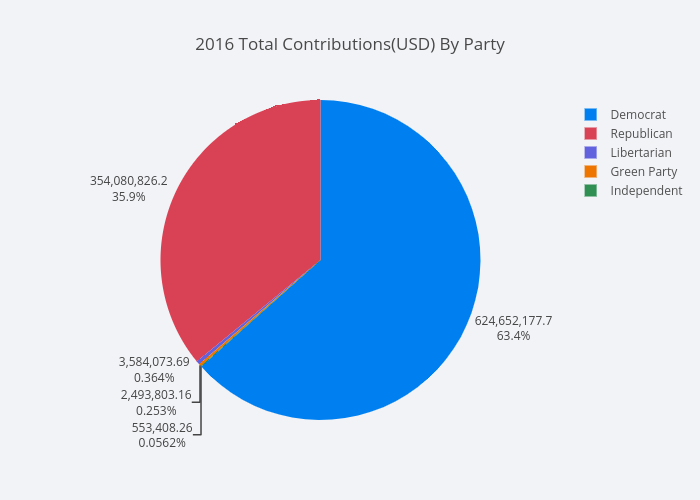
Mholtzscher's interactive graph and data of "2016 Total Contributions(USD) By Party" is a pie. The x-axis shows values from 0 to 0. The y-axis shows values from 0 to 0.