Edit chart
Loading graph
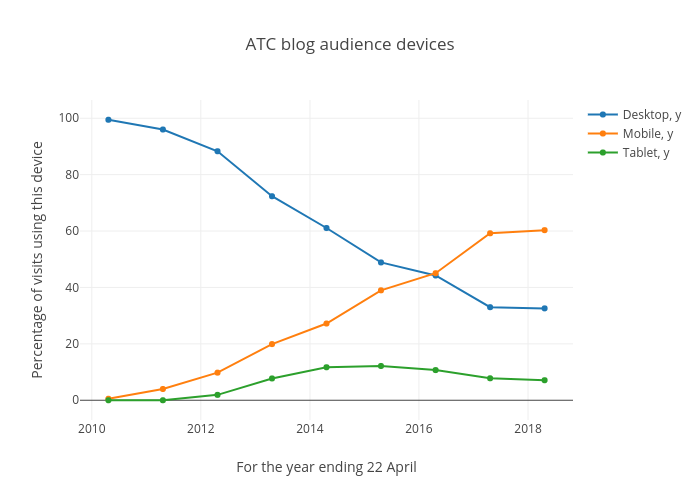
Micahwoods's interactive graph and data of "ATC blog audience devices" is a scatter chart, showing Desktop, y, Mobile, y, Tablet, y; with For the year ending 22 April in the x-axis and Percentage of visits using this device in the y-axis.. The x-axis shows values from 2009-10-28 23:37:30 to 2018-10-14 00:22:30. The y-axis shows values from -6.5664181726907636 to 106.03641817269076.