Edit chart
Loading graph
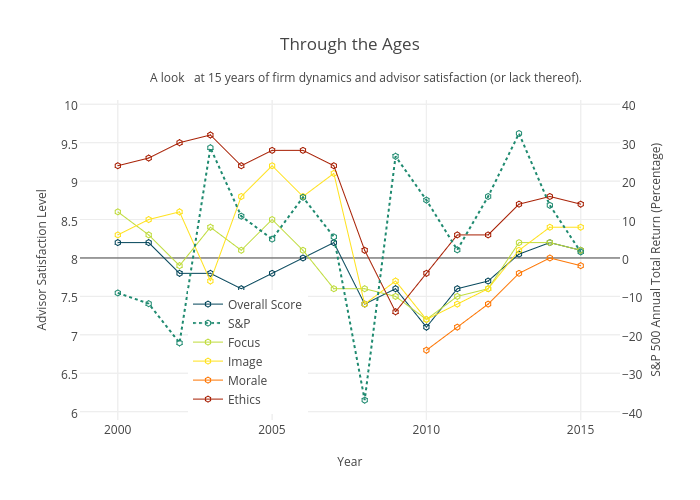
Michaelhsamuels's interactive graph and data of "Through the Ages" is a scatter chart, showing Overall Score, S&P, Focus, Image, Morale, Ethics; with Year in the x-axis and Advisor Satisfaction Level in the y-axis.. The x-axis shows values from 1998.774625331282 to 2016.2732109505748. The y-axis shows values from 5.891964481146674 to 10.055207577916244. This visualization has the following annotation: A look at 15 years of firm dynamics and advisor satisfaction (or lack thereof).