Edit chart
Loading graph
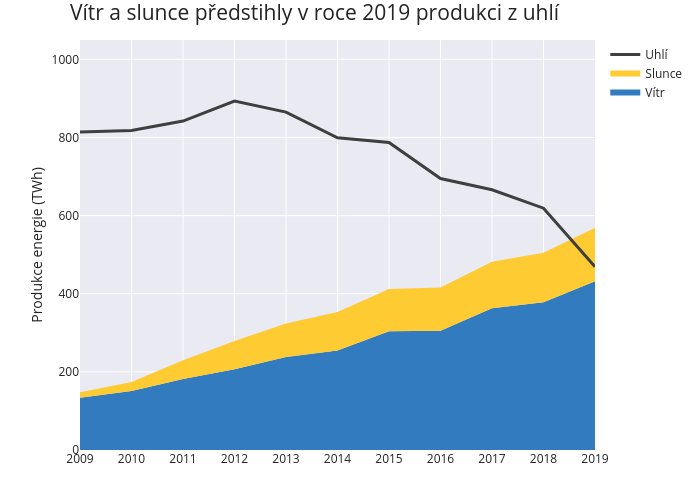
Michalberg's interactive graph and data of "Vítr a slunce předstihly v roce 2019 produkci z uhlí" is a , showing Vítr, Slunce, Uhlí; with Produkce energie (TWh) in the y-axis. The x-axis shows values from 0 to 0. The y-axis shows values from 0 to 1049.4768421052631.