Edit chart
Loading graph
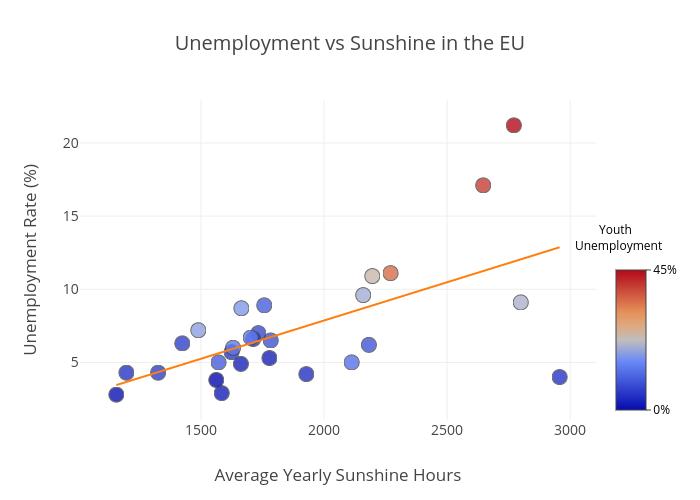
Michetonu's interactive graph and data of "Unemployment vs Sunshine in the EU" is a scatter chart; with Average Yearly Sunshine Hours in the x-axis and Unemployment Rate (%) in the y-axis.. The x-axis shows values from 1022.9706916249231 to 3090.0293083750767. The y-axis shows values from 0.9924195861503788 to 23.00758041384962. This visualization has the following annotation: Youth Unemployment