Edit chart
Loading graph
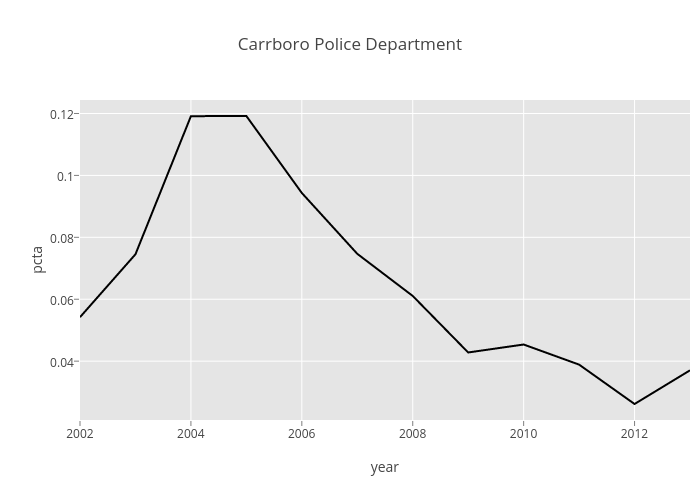
Mike.dolan.fliss's interactive graph and data of "Carrboro Police Department" is a line chart, showing None; with year in the x-axis and pcta in the y-axis.. The x-axis shows values from 0 to 0. The y-axis shows values from 0 to 0.