Edit chart
Loading graph
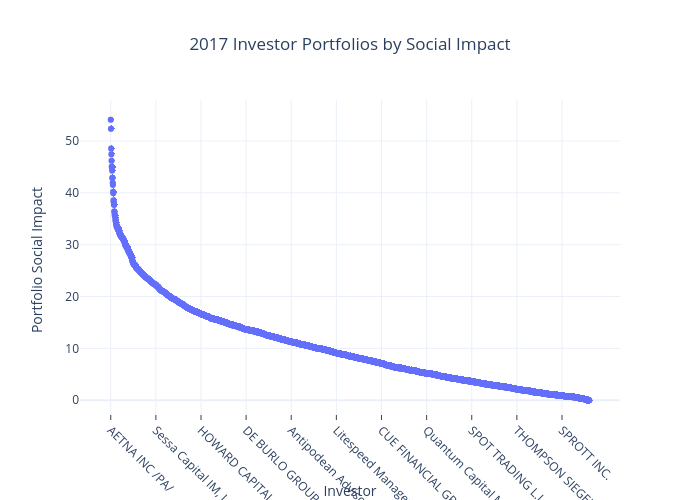
Mike.jiao's interactive graph and data of "2017 Investor Portfolios by Social Impact" is a scatter chart; with Investor in the x-axis and Portfolio Social Impact in the y-axis.. The x-axis shows values from -149.428865131579 to 2588.428865131579. The y-axis shows values from -4.154951142338823 to 58.23833511470928.