Edit chart
Loading graph
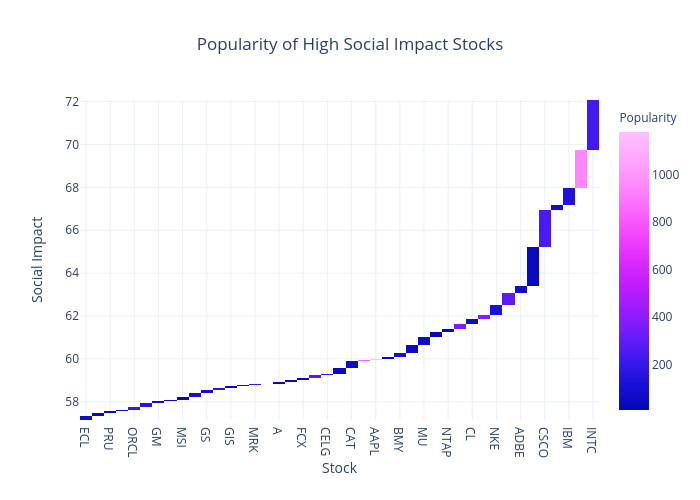
Mike.jiao's interactive graph and data of "Popularity of High Social Impact Stocks" is a heatmap; with Stock in the x-axis and Social Impact in the y-axis.. The x-axis shows values from -0.5 to 0.5. The y-axis shows values from 57.14747979336995 to 72.07902913281849.