Edit chart
Loading graph
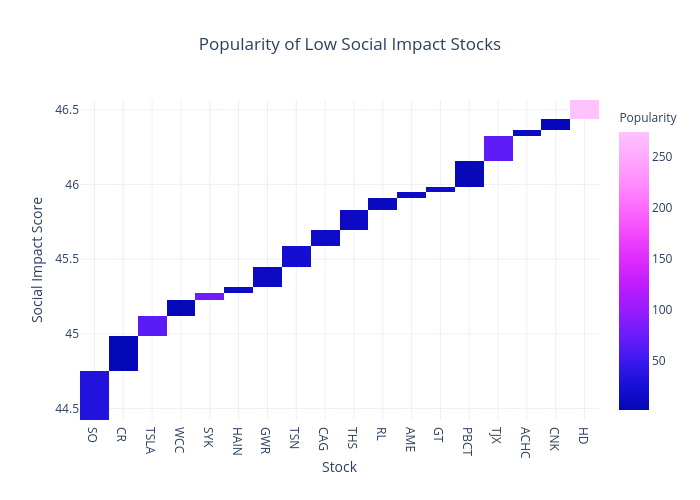
Mike.jiao's interactive graph and data of "Popularity of Low Social Impact Stocks" is a heatmap; with Stock in the x-axis and Social Impact Score in the y-axis.. The x-axis shows values from -0.5 to 17.5. The y-axis shows values from 44.587225307642896 to 44.9151339582051.