Edit chart
Loading graph
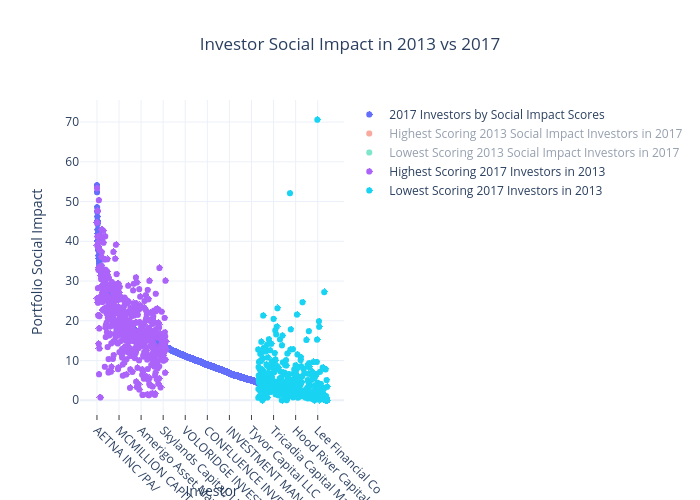
Mike.jiao's interactive graph and data of "Investor Social Impact in 2013 vs 2017" is a scatter chart, showing 2017 Investors by Social Impact Scores, Highest Scoring 2013 Social Impact Investors in 2017, Lowest Scoring 2013 Social Impact Investors in 2017, Highest Scoring 2017 Investors in 2013, Lowest Scoring 2017 Investors in 2013; with Investor in the x-axis and Portfolio Social Impact in the y-axis.. The x-axis shows values from -156.85876418663307 to 2595.858764186633. The y-axis shows values from -5.422175044477937 to 76.00051997558941.