Edit chart
Loading graph
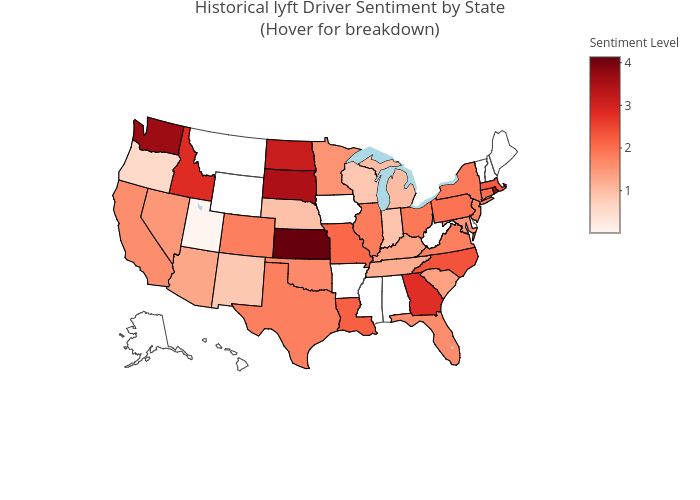
Mikeberg's interactive graph and data of "Historical lyft Driver Sentiment by State(Hover for breakdown)" is a choropleth. The x-axis shows values from 0 to 0. The y-axis shows values from 0 to 0.