Edit chart
Loading graph
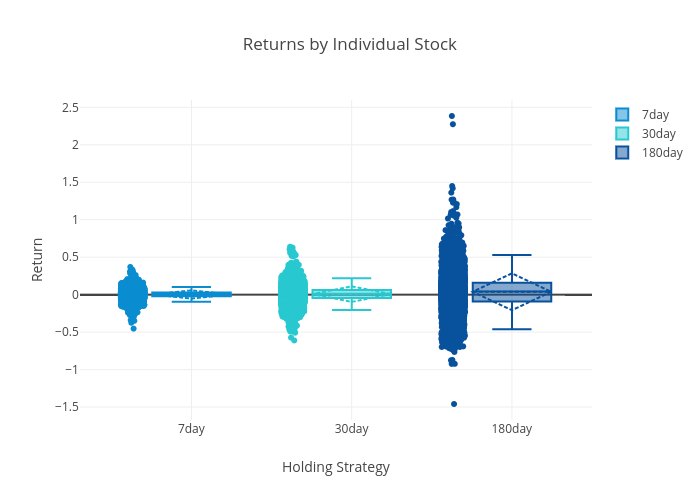
Mikejchuang's interactive graph and data of "Returns by Individual Stock" is a box plot, showing 7day, 30day, 180day; with Holding Strategy in the x-axis and Return in the y-axis.. The x-axis shows values from 0 to 0. The y-axis shows values from 0 to 0.