Edit chart
Loading graph
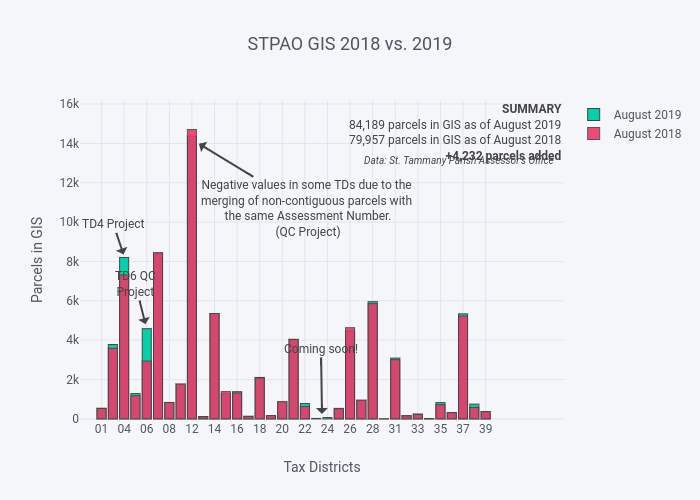
Mikus31's interactive graph and data of "STPAO GIS 2018 vs. 2019" is a overlaid bar chart, showing August 2019 vs August 2018; with Tax Districts in the x-axis and Parcels in GIS in the y-axis.. The x-axis shows values from -0.5 to 34.5. The y-axis shows values from 0 to 15595.64567769477. This visualization has the following annotations: SUMMARY84,189 parcels in GIS as of August 2019 79,957 parcels in GIS as of August 2018 +4,232 parcels added; Negative values in some TDs due to themerging of non-contiguous parcels with the same Assessment Number. (QC Project); TD4 Project; TD6 QCProject; Coming soon!; Data: St. Tammany Parish Assessor's Office