Edit chart
Loading graph
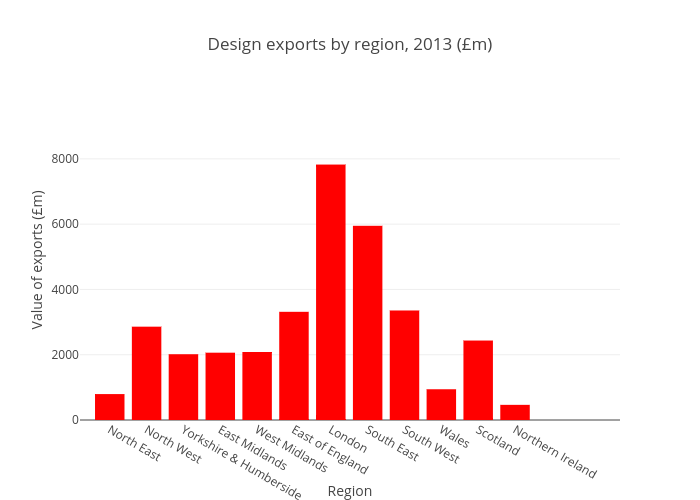
Milski360's interactive graph and data of "Design exports by region, 2013 (£m)" is a bar chart, showing Exports; with Region in the x-axis and Value of exports (£m) in the y-axis.. The x-axis shows values from -0.8075516912964227 to 13.849281406625616. The y-axis shows values from 0 to 9802.72700226417.