Edit chart
Loading graph
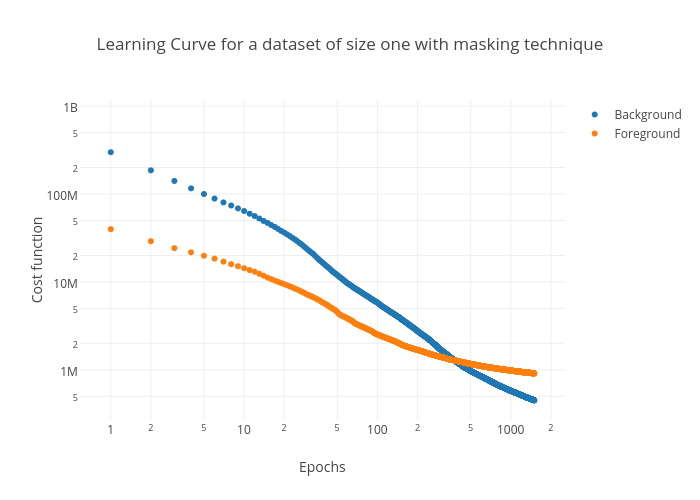
Mjenrungrot12f5's interactive graph and data of "Learning Curve for a dataset of size one with masking technique" is a scatter chart, showing Background vs Foreground; with Epochs in the x-axis and Cost function in the y-axis.. The x-axis shows values from -0.1956109701392056 to 3.3714126029874847. The y-axis shows values from 5.436579944460541 to 9.061300237316633.