Edit chart
Loading graph
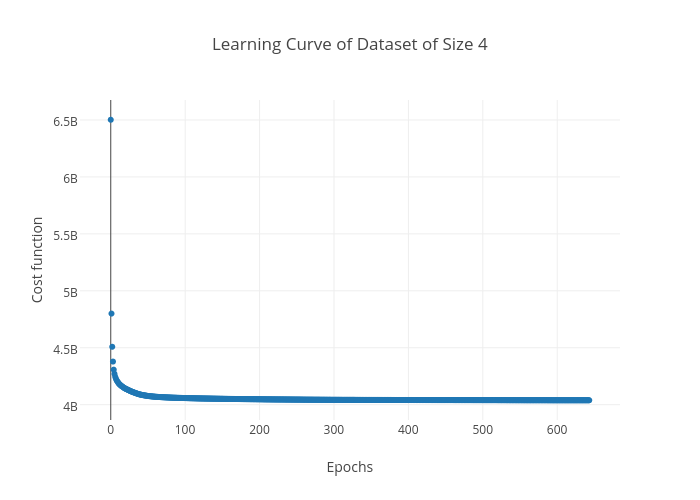
Mjenrungrot12f5's interactive graph and data of "Learning Curve of Dataset of Size 4" is a scatter chart, showing A; with Epochs in the x-axis and Cost function in the y-axis.. The x-axis shows values from -39.31890186602228 to 682.3189018660223. The y-axis shows values from 3871247094.1007195 to 6669385225.899281.